The real costs of you portfolio
The 7 costs hiding in your equipment portfolio (and how to make them visible)
Uncover the costs that don't make it into your reporting and start driving them down.
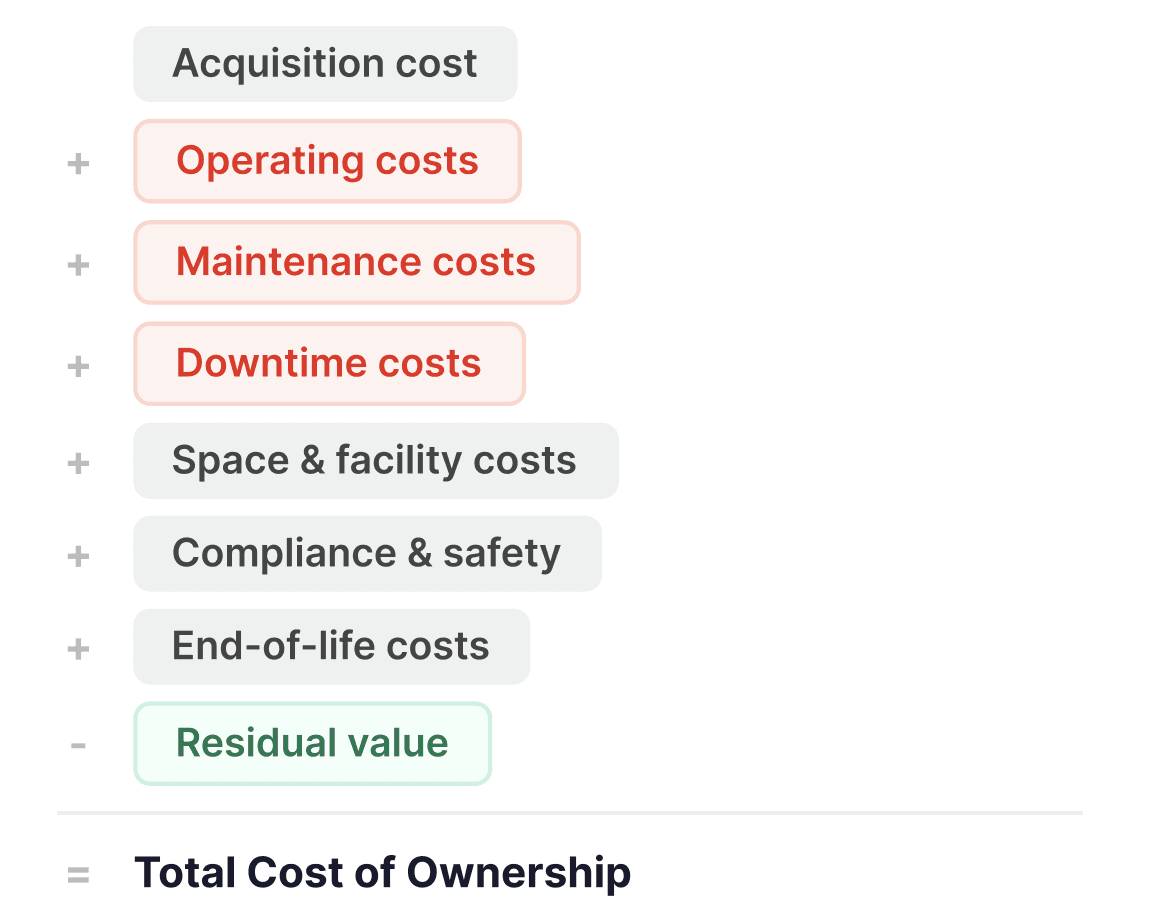
Most organisations know what they paid for a machine. Far fewer know what that machine actually costs them every month it sits on the floor.
Purchase price is the visible part. Below the surface: energy waste on idle equipment, operator time lost to manual admin, emergency repairs that could have been prevented, and compliance exposure that only becomes expensive after an incident. These hidden costs compound quietly, and by the time they surface in a quarterly review, the damage is done.
This is what Total Cost of Ownership looks like when you break it down honestly.
1. Acquisition: visible, but often avoidable
The purchase price, delivery, and installation of a new machine are the costs everyone sees. What most teams miss is the question that should come before the purchase order: do we actually need this machine, or do we have unused capacity somewhere else?
Without real utilisation data, that question is impossible to answer. Departments default to buying because no one can prove the existing fleet has room. Load balancing across labs, removing scheduling bottlenecks, and surfacing available assets before a purchase is approved can eliminate unnecessary CAPEX entirely.
2. Operating costs: death by a thousand spreadsheets
Energy and consumables are straightforward. The less obvious drain is operator labour time per job and the admin overhead around it: physical notebooks, Outlook calendars, and messy pivot tables that no one trusts.
These hidden operating costs can run up to €920 per day in environments with high equipment density. The problem is not that the work is hard. The problem is that it is manual, error-prone, and invisible to anyone outside the lab.
When every session is tracked automatically and attributed to a user, team, and project, operating cost per job becomes a real number instead of an estimate.
3. Maintenance: the most expensive surprise
Emergency repairs on mid-range lab equipment average €3,000 to €5,000 per incident. A single service technician call-out costs around €1,200. These are not rare events in labs where machines run without structured oversight.
The pattern is predictable: a small issue goes unreported because reporting is inconvenient. The small issue becomes a breakdown. The breakdown triggers an emergency repair at three to five times the cost of a planned service visit.
Planned maintenance and clear ownership of every machine break that cycle. When users report issues at the point of use and the lab manager gets an immediate notification, small problems stay small. Real incident data also gives you leverage in SLA negotiations with service providers, because you can show exactly what went wrong and when.
4. Downtime: the cost nobody budgets for
Unplanned downtime is the most hidden cost category in most equipment portfolios. Lost production output averages €200 per hour. Idle operators waiting for a machine add another €120 per hour on top. Rush replacements and cascade delays push that number higher.
Most organisations do not track downtime systematically, which means they cannot quantify it, which means it never appears in a business case. It should. For a lab running 20 machines, even modest downtime improvements translate into tens of thousands in recovered capacity per year.
The fix is not complicated: catch problems the moment they happen instead of days later, and keep maintenance proactive instead of reactive.
5. Compliance and safety: cheap to prevent, expensive to fix
Incident liability, fines, audit preparation, and operator recertification are recurring costs driven by risk. The numbers are unpredictable and can escalate fast: a single compliance failure can lead to insurance claims, regulatory action, or (in the worst case) facility shutdown.
Prevention is always cheaper. Role-based and training-based access control ensures only authorised, trained users operate each machine. An immutable audit trail makes compliance reporting instant rather than a week-long exercise before every audit cycle.
6. End-of-life: the cost of holding on too long
Every month of delay in decommissioning an ageing asset erodes its residual value, ties up valuable floor space, and keeps unnecessary maintenance costs running. Most organisations miss this because they lack the lifecycle data to make a confident disposal decision.
Continuous usage tracking surfaces the machines that are quietly draining your budget: low utilisation, rising maintenance frequency, declining performance. Full lifecycle data supports optimal disposal timing so you recover maximum residual value instead of writing off assets that should have been replaced a year earlier.
7. Residual value: the upside most teams leave on the table
A well-timed disposal, supported by complete usage and maintenance records, recovers significantly more value than a forced write-off. Buyers pay more for equipment with a documented history. Lifecycle data turns end-of-life from a cost event into a value recovery opportunity.
Making it all visible
The TCO framework is not theoretical. Every cost category listed above is either already hitting your budget or building up as a future liability. The difference between organisations that manage these costs and those that absorb them comes down to one thing: data.
When every machine interaction is logged automatically (who used it, when, for how long, on which project, and in what condition they left it), all seven cost layers become visible and manageable. Acquisition decisions are grounded in utilisation data. Operating costs are attributed accurately. Maintenance shifts from reactive to planned. Downtime gets measured and reduced. Compliance is built into the daily workflow. End-of-life timing is based on facts, not guesswork.
Toolsquare surfaces all of this from a single platform: physical access control, automatic usage tracking, cost allocation, incident management, and management dashboards that break down your TCO per machine, per lab, and per cost category.
For most organisations, the payback period is measured in weeks, not years. Once the real cost of downtime, repair, and avoided CAPEX becomes visible, the investment case is simple.